Using Social Network Analysis to Understand Links Between Teacher Leader Roles and Student Achievement


Data used for analysis are shown in Table 1. Initial evidence suggests that weak-positive relationships exist between MTL and MTS roles and student achievement. A moderate-positive strength relationship exists between network density and student achievement. However, MTL role and network density were found to be significantly correlated, with MTL role accounting for approximately 22% of the variance in network density. These results are depicted through scatter plots. Discussion of the results is supported by examining several sociograms that illustrate the concepts and ideas explored through this work.
Table 1. Social Network Analysis Data for 29 SchoolsID | Total Named | Network | In-School | MTL | MTS | Student Achievement |
1 | 78 | 5.3% | 8.8% | 18.8 | 0.6 | 38% |
2 | 57 | 3.8% | 13.7% | 7.6 | 0.4 | 66% |
3 | 45 | 4.2% | 8.0% | 12.5 | 13.1 | 28% |
4 | 43 | 11.7% | 20.1% | 30.6 | 4.4 | 50% |
5 | 48 | 3.9% | 7.6% | 11.7 | 2.1 | 20% |
6 | 49 |
5.5% | 7.6% | 20.8 | 0.5 | 56% |
7 | 78 | 3.5% | 4.7% | 17.0 | 0.6 | 45% |
8 | 47 | 7.1% | 14.8% | 13.5 | 3.5 | 51% |
9 | 38 | 7.8% | 12.7% | 28.4 | 0.7 | 47% |
10 | 33 | 7.2% | 13.2% | 17.2 | 0.2 | 58% |
11 | 95 | 3.8% | 13.8% | 11.7 | 3.2 | 67% |
12 | 87 | 3.0% | 10.5% | 11.0 | 5.8 | 70% |
13 | 59 | 9.5% | 15.6% | 28.0 | 12.5 | 71% |
14 | 61 | 6.3% | 9.2% | 6.7 | 3.8 | 53% |
15 | 80 |
4.7% | 7.9% | 11.7 | 6.0 | 46% |
16 | 45 |
9.6% | 28.8% | 7.3 | 6.3 | 59% |
17 | 31 |
7.2% | 11.7% | 3.3 | 2.5 | 34% |
18 | 42 |
6.1% | 7.5% | 9.5 | 1.2 | 20% |
19 | 40 | 6.2% | 9.0% | 17.3 | 3.9 | 24% |
20 | 86 |
4.3% | 10.2% | 11.5 | 0.3 | 25% |
21 | 46 | 9.8% | 28.6% | 22.2 | 8.3 | 45% |
22 | 79 | 5.0% | 12.1% | 16.3 | 5.4 | 53% |
23 | 45 | 5.8% | 28.4% | 13.1 | 1.1 | 54% |
24 | 52 |
4.3% | 15.4% | 17.2 | 2.9 | 27% |
25 | 47 | 7.0% | 11.0% | 27.7 | 8.7 | 48% |
26 | 52 | 4.0% | 7.1% | 19.7 | 1.9 | 36% |
27 | 71 | 4.0% | 11.0% | 13.6 | 0.4 | 20% |
28 | 40 | 5.7% | 10.6% | 16.0 | 0.6 | 42% |
29 | 110 | 2.6% | 7.0% | 12.8 | 0.9 | 57% |
|
|
|
|
|
|
|
Mean |
58 | 5.8% | 12.6% | 15.7 | 3.5 | 45% |
Median | 49 | 5.5% | 11.0% | 13.6 | 2.5 | 47% |
Std. Dev. | 20 | 2.2% | 6.4% | 6.8 | 3.5 | 16% |
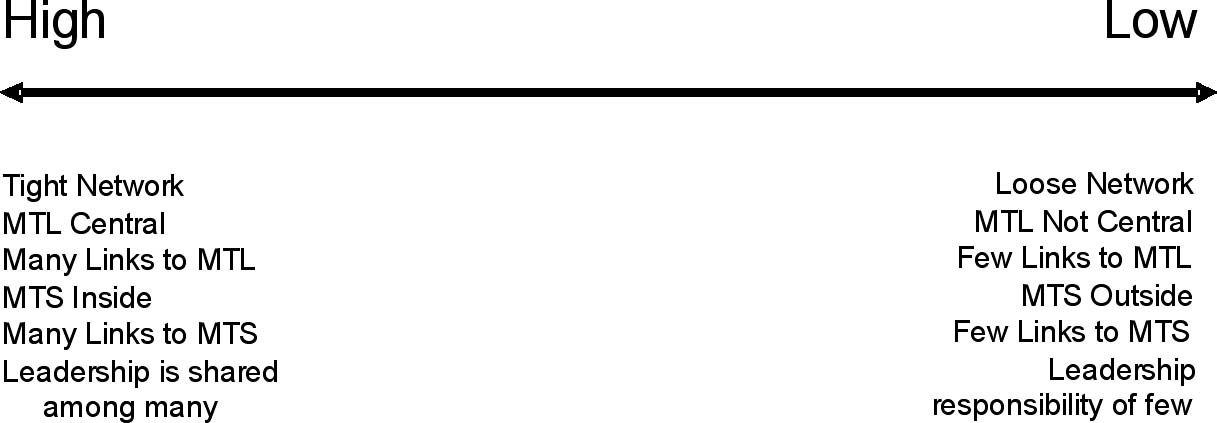
In addition, this work has enabled us to develop a working continuum of distributed leadership as shown in Figure 2, below. The continuum indicates what we believe are positive and negative exemplars. Schools with strong distributed leadership will likely exhibit characteristics that lean toward the High end of the continuum. Schools with emerging distributed leadership will exhibit characteristics toward the lower end. Rarely do schools exhibit all high or low characteristics.
Figure 2. Distributed Leadership Continuum