Improving Mathematics Discourse Among Students: Results and Lessons Learned from a 4-Year Study


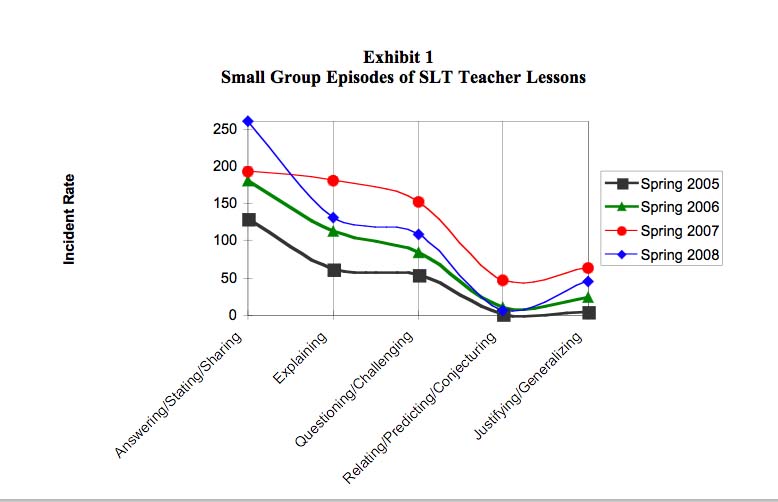
Finding 1-Because the design of the OMLI model involves working directly with an SLT whose members in turn work with the other teachers in their school, project staff initially predicted that any change in student discourse would be evident among the students of the SLT teachers sooner. Analysis of the small-group episodes reveals the change in the quantity and quality of student discourse the OMLI project leadership envisioned. The discourse profile for the SLT teachers' lessons show a significant increase in the quantity of student discourse over time and a slight shift toward higher cognitive levels. This shift is evident in the spring 2006 profile, becomes more pronounced in the spring 2007 profile, and then recedes in spring 2008. A similar pattern is evident in the discourse profiles of the other teachers' lessons, but the shift emerges in the spring 2007 profile, a year later than in the SLT teachers' lessons, and then becomes very pronounced in spring 2008 See Exhibit 1.
Further evidence of increased student discourse can be found in the annual teacher survey results. SLT teachers reported on the winter 2007 and 2008 surveys that their students were engaged in discourse at a rate significantly higher than the other teachers. In addition, the discourse index score increased significantly for the SLT teachers between the spring 2005 survey and the winter 2008 survey.
Finding 2-Analysis of the mathematics student achievement data for Grades 8 and 10 indicates that the degree to which schools implement the practices promoted by OMLI, as measured by the secondary implementation scale, was a significant positive predictor of student performance above and beyond what could be explained by socioeconomic factors, as indicated by the percentage of students who qualified for the free and reduced-price lunch program. The secondary implementation scale measured the quality of the action plan developed by the school leadership team, the degree to which the team implemented the plan, the degree to which the team conducted school-based professional development that reached a critical mass of the mathematics teacher in the school, and the degree to which the professional development utilized the professional learning tasks and protocols introduced at the summer institute (see Exhibits 2 & 3).
Analysis of Grade 8 Implementation vs. Student Achievement
Predictor |
Unstandardized Coefficients |
Standardized Coefficients |
|
|
|
B |
SE |
Beta |
t |
p. |
|
(Constant) |
.737 |
.005 |
|
154.340 |
<.001 |
FRLP |
-.418 |
.005 |
-.671 |
-76.860 |
<.001 |
SIS |
.002 |
.000 |
.262 |
29.982 |
<.001 |
Analysis of Grade 10 Implementation vs. Student Achievement
Predictor |
Unstandardized Coefficients |
Standardized Coefficients |
|
|
|
B |
SE |
Beta |
t |
p. |
|
(Constant) |
.743 |
.006 |
|
123.700 |
<.001 |
FRLP |
-.991 |
.011 |
-.804 |
-87.277 |
<.001 |
SIS |
.001 |
.000 |
.076 |
8.226 |
<.001 |
Finding 3-Teachers demonstrated significant increases in their mathematics content knowledge after each successive summer institute as measured by pre- and postassessments. After completing 2 content courses at the conclusion of the 2005 summer institute, teachers demonstrated some growth in their mathematics content knowledge but the growth was limited to subscales of the assessment that correlated closely to the content of the courses completed by the participants. After completing 4 of the 6 courses at the conclusion of the 2006 summer institute, teachers demonstrated significant growth in some areas. The secondary teachers demonstrated significant positive growth on the arithmetic and algebra scale, but growth on the geometry scale was not statistically significant. The elementary teachers demonstrated significant growth on the number concepts and operations scale and the geometry scale but not on the patterns, functions, and algebra scale. After completing all 6 content courses at the conclusion of the 2007 summer institute, teachers demonstrated significant mathematics content knowledge gains overall and on all subscales of the assessment (see Exhibits 4 & 5).
2007 Secondary SLT Teacher Content Knowledge Results
Scale |
Survey |
N |
M |
SD |
M Diff |
SE |
p |
Arithmetic and Algebra |
Pre- |
78 |
.767 |
.938 |
.397 |
.085 |
< .001 |
|
Post- |
78 |
1.164 |
.774 |
|
|
|
Geometry |
Pre- |
78 |
.889 |
.554 |
.192 |
.063 |
.003 |
|
Post- |
78 |
1.081 |
.581 |
|
|
|
Overall |
Pre- |
78 |
.761 |
.129 |
.055 |
.010 |
< .001 |
|
Post- |
78 |
.816 |
.107 |
|
|
|
2007 Elementary SLT Teacher Content Knowledge Results
Scale |
Survey |
N |
M |
SD |
M Diff |
SE |
p |
Number Concepts and Operations |
Pre- |
84 |
-.100 |
.891 |
.343 |
.085 |
< .001 |
|
Post- |
84 |
.243 |
.799 |
|
|
|
Geometry |
Pre- |
84 |
.228 |
.780 |
.479 |
.068 |
< .001 |
|
Post- |
84 |
.707 |
.802 |
|
|
|
Patterns, Functions, and Algebra |
Pre- |
84 |
.101 |
.801 |
.372 |
.083 |
< .001 |
|
Post- |
84 |
.473 |
.807 |
|
|
|
Overall |
Pre- |
84 |
.644 |
.155 |
.077 |
.010 |
< .001 |
|
Post- |
84 |
.720 |
.141 |
|
|
|
